OEE & Preventive Maintenance (TPM) Tracker
A Notion template that works as an OEE tracker, a downtime log and a preventive maintenance (TPM) plan
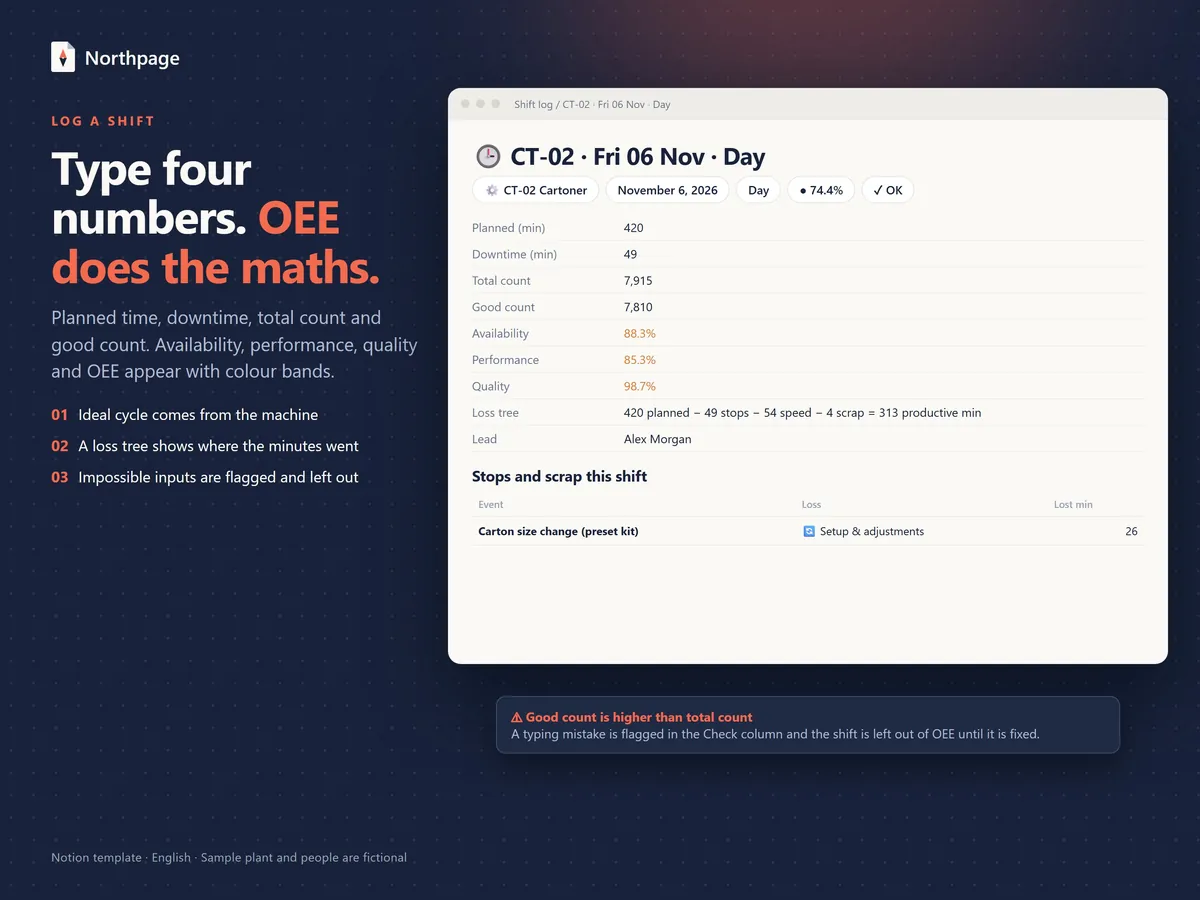
Know why your machines stop, and fix the biggest loss first. You log one entry per machine per shift with four numbers: planned time, downtime, total count and good count. Availability, performance, quality and OEE calculate themselves, and every stop or scrap event you log lands in a ranked list of the six big losses.
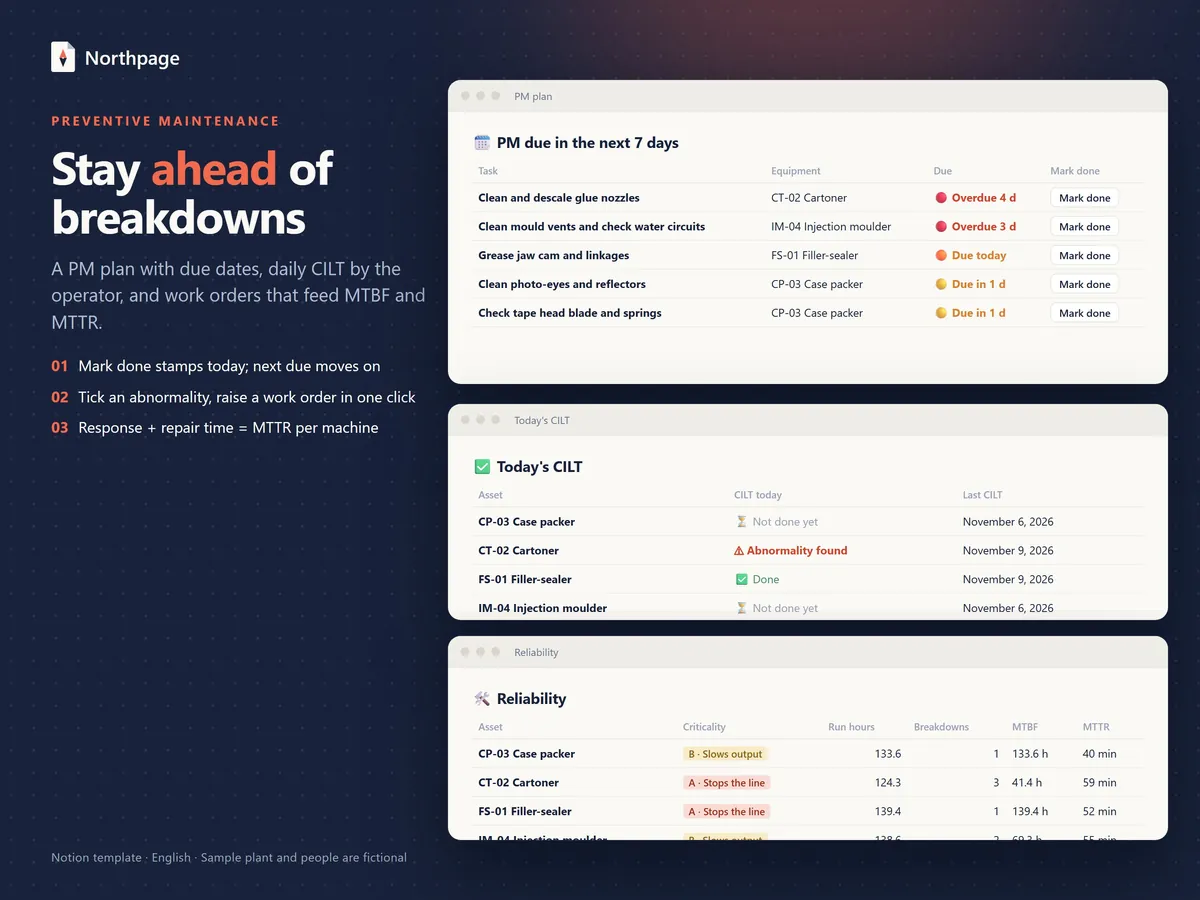
The same workspace covers preventive maintenance: a PM plan whose due dates keep themselves up to date, daily CILT checks, and work orders that feed MTBF and MTTR per machine. It uses no charts, no Notion automations and no Notion AI, so it runs on Notion's Free plan.
$29Pay once, no subscription · checkout on Etsy or Gumroad
Watch the Short about OEE & Preventive Maintenance (TPM) Tracker on YouTube · 20 s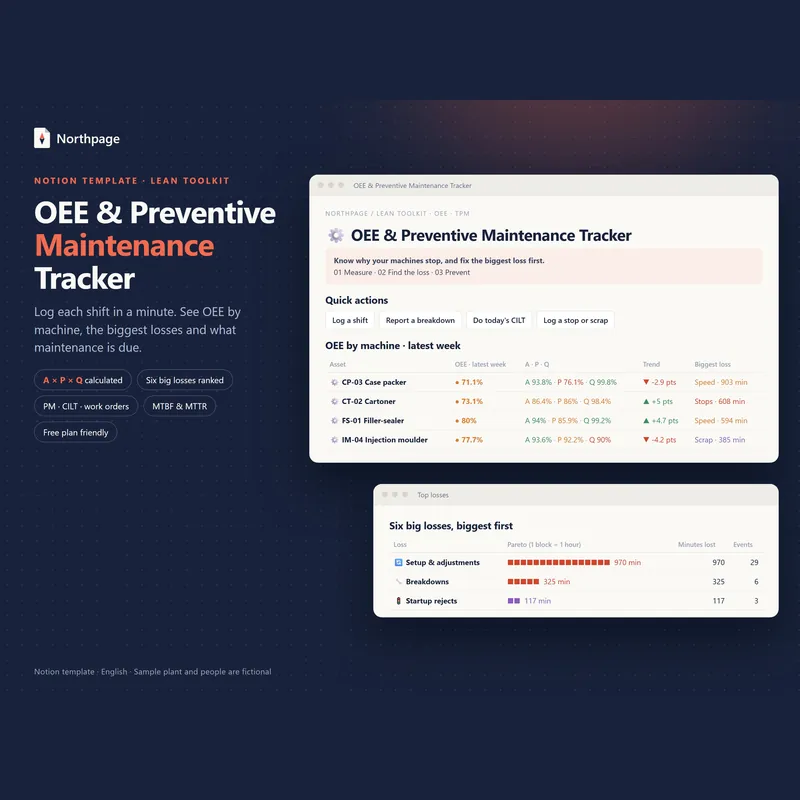
What's inside
Dashboard
One page shows OEE by machine for the latest week, lowest first, with availability, performance and quality, the trend against the week before and the biggest loss. Below it sit open work orders, PM due in the next 7 days, today's CILT status, the top losses, reliability and the latest shifts.
Shift log
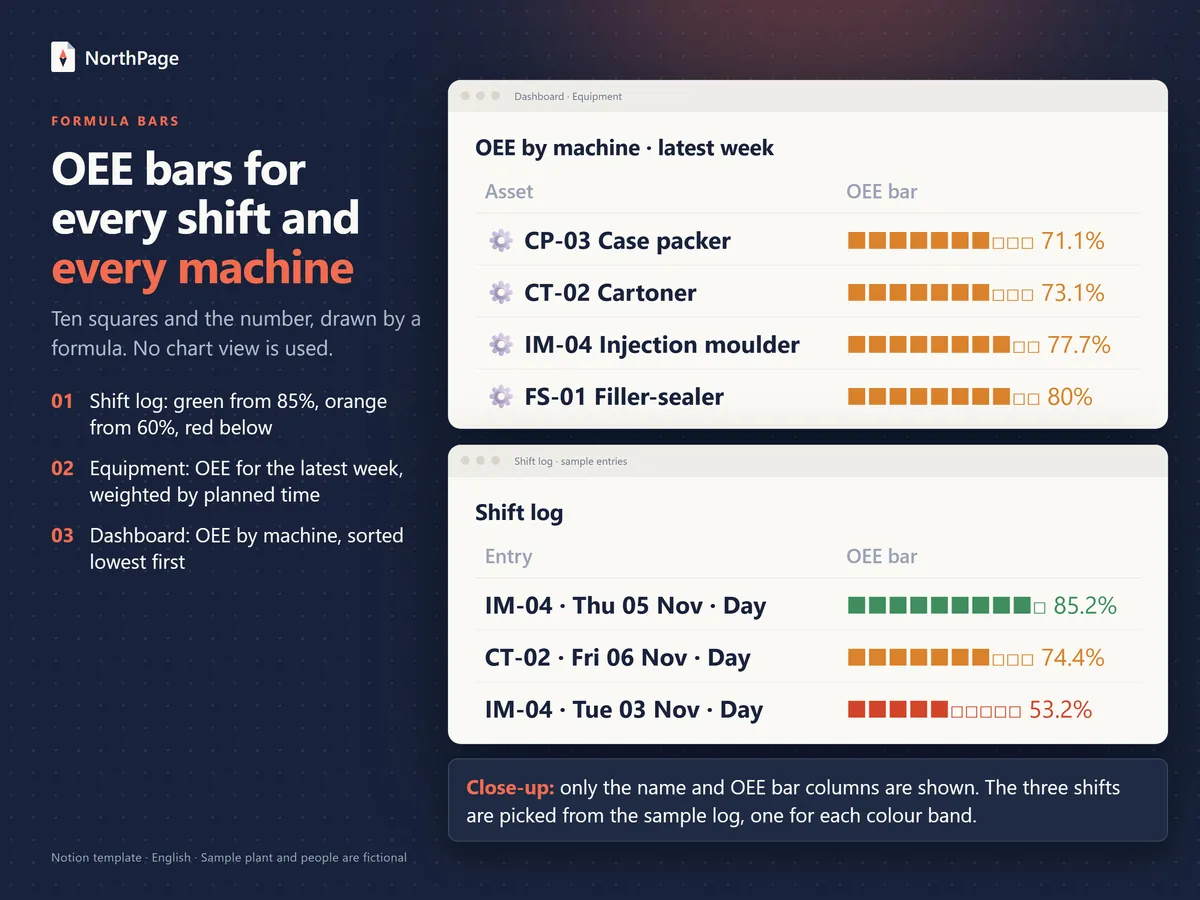
One entry per machine per shift: planned time, downtime, total count and good count. Availability, Performance, Quality and OEE appear with colour bands, along with a ten-square OEE bar and a loss tree that shows in minutes where the shift went.
Input checks
A Check column flags entries that cannot be right: a good count higher than the total, downtime longer than planned time, or a count faster than the ideal cycle allows. A flagged shift is left out of OEE until it is fixed.
Six big losses and the loss log
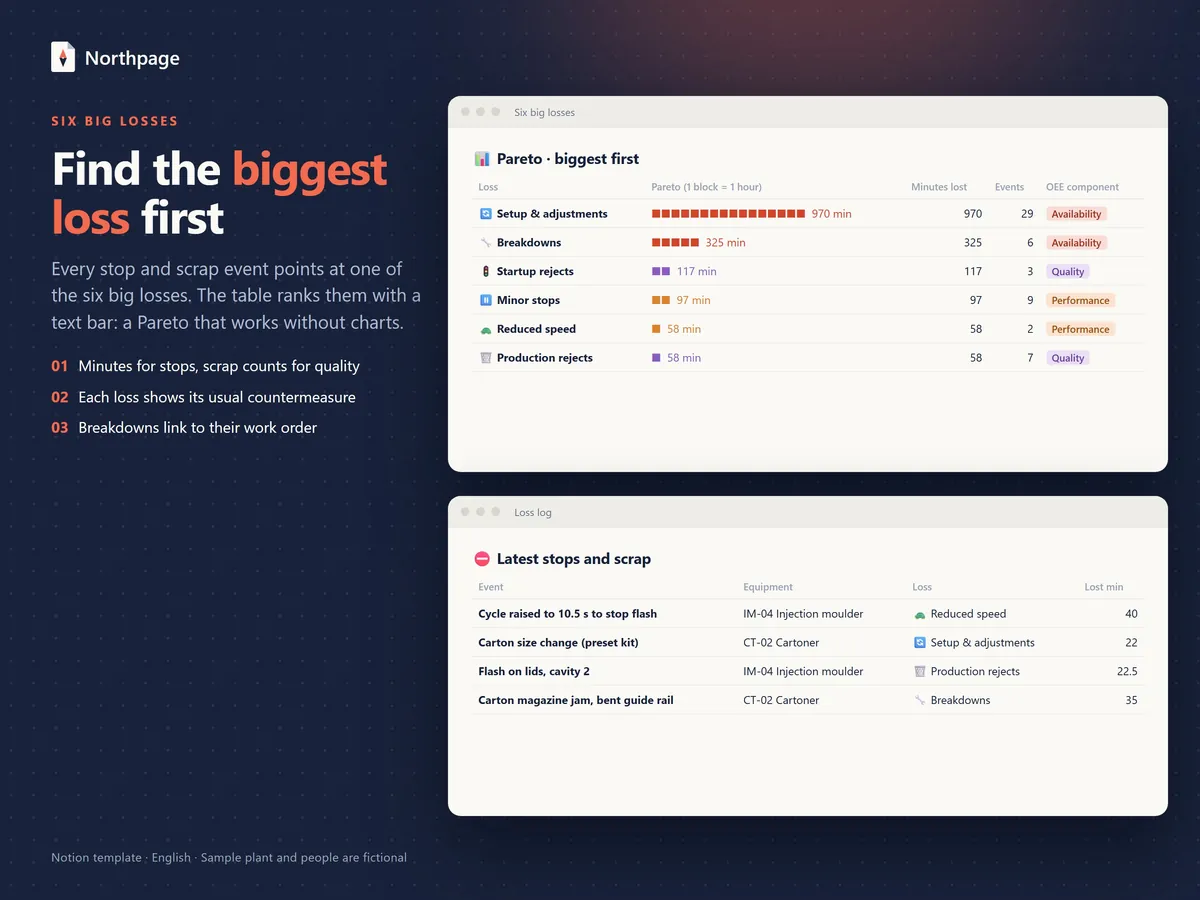
Each stop or scrap event points at one loss: breakdowns, setup and adjustments, minor stops, reduced speed, startup rejects or production rejects. The six rank themselves biggest first with a text bar where one block is one hour, a Pareto that needs no chart, and each loss shows its usual countermeasure.
Equipment register
Each machine carries its line, criticality, ideal cycle time and CILT standard. The register shows its OEE for the latest week, weighted by planned time, plus MTBF (run hours ÷ breakdowns) and MTTR (the average time from reported to finished on breakdowns).
PM plan
One row per recurring task: machine, how often, last done and next due, with a flag for overdue, due today or due within 7 days. A Mark done button stamps today's date and the next due date moves on.
Daily CILT checks and work orders
CILT checks cover clean, inspect, lubricate and tighten against each machine's standard; tick an abnormality and one click raises a work order linked to that check. Work orders cover breakdowns, planned jobs, CILT findings and improvements, and work out repair time and time to restore, plus response time on breakdowns and CILT findings.
Buttons, page templates and guides
Four quick-action buttons (Log a shift, Report a breakdown, Do today's CILT, Log a stop or scrap), each with a ready-made page template. A Start Here page covers setup, and an OEE & TPM guide explains A × P × Q with a worked example, the six big losses, planned versus autonomous maintenance and common OEE mistakes.
What it looks like
How it works
Duplicate the template
Open the template link, sign in to Notion and click Duplicate to copy the template into your workspace. Then open Start Here; setup takes about 10 minutes.
Add your machines and PM tasks
In Equipment, rename the sample machines or add your own, and give each one its ideal cycle time in seconds per piece. In PM plan, add one row per recurring task with how often it is due and when it was last done.
Log each shift and its stops
Click Log a shift, pick the machine and type planned time, downtime, total count and good count. Add each stop or scrap batch and pick one of the six big losses.
Run CILT and work orders
Click Do today's CILT for the daily check and raise a work order when you tick an abnormality. Report breakdowns as work orders and click Mark done when a PM task is finished.
Review once a week
Read OEE by machine and its trend, take the top loss and agree one countermeasure. Book the PM tasks due in the next 7 days and close finished work orders.
Who it's for
- Production supervisors who want OEE for every shift and every machine
- Maintenance leads who run a PM plan, daily CILT checks and work orders
- Lean and CI engineers who need the six big losses ranked before they choose a countermeasure
- Small plants that want a clear way to measure OEE inside Notion
What you need
- A Notion account. The template uses no charts, no Notion automations and no Notion AI, so it runs on Notion's Free plan; Notion's own plan limits still apply.
- On Etsy you download a PDF with the template link and the duplication steps. On Gumroad the link is on the page you see after checkout, along with a PDF that has the same link, a QR code and a quick-start guide.
- You get the dashboard, seven linked databases (Equipment, Shift log, Loss log, Six big losses, Work orders, PM plan, CILT checks), four quick-action buttons, four page templates, a Start Here page and the OEE & TPM guide.
- A fictional sample plant fills every view when you open it: 4 machines, 80 shifts over two weeks, 56 loss events, 18 work orders, 13 PM tasks and daily CILT records.
- The template is in English. It was set up and tested in a desktop browser, so use a computer for your first setup; the Start Here page takes about 10 minutes.
Questions about this template
How does the template calculate OEE?
Availability is run time ÷ planned time, performance is ideal cycle × total count ÷ run time, and quality is good count ÷ total count; OEE is the three multiplied. Each machine has its own ideal cycle time, and a shift can override it for a product with a different cycle. A machine's weekly figure covers the 7 days up to its last logged shift and is weighted by planned time.
Is there a Pareto chart or an OEE chart?
No chart views are used. The Pareto is a table sorted biggest first with a text bar, and OEE is drawn by a formula as ten squares plus the number: green from 85%, orange from 60%, red below.
Can I change the machines, losses and maintenance tasks?
Yes. Rename or add machines, PM tasks and CILT points, and clear the sample records when you are ready. Keep the six rows in Six big losses, because they power the ranking.
Does it send reminders when maintenance is due?
No. Buttons create pages and stamp dates; they do not send notifications or reminders, and people's names are plain text, so nobody is notified. The dashboard lists the PM tasks due in the next 7 days, overdue ones included, and each task shows its due flag.
Is this tracker part of the Lean Toolkit Bundle?
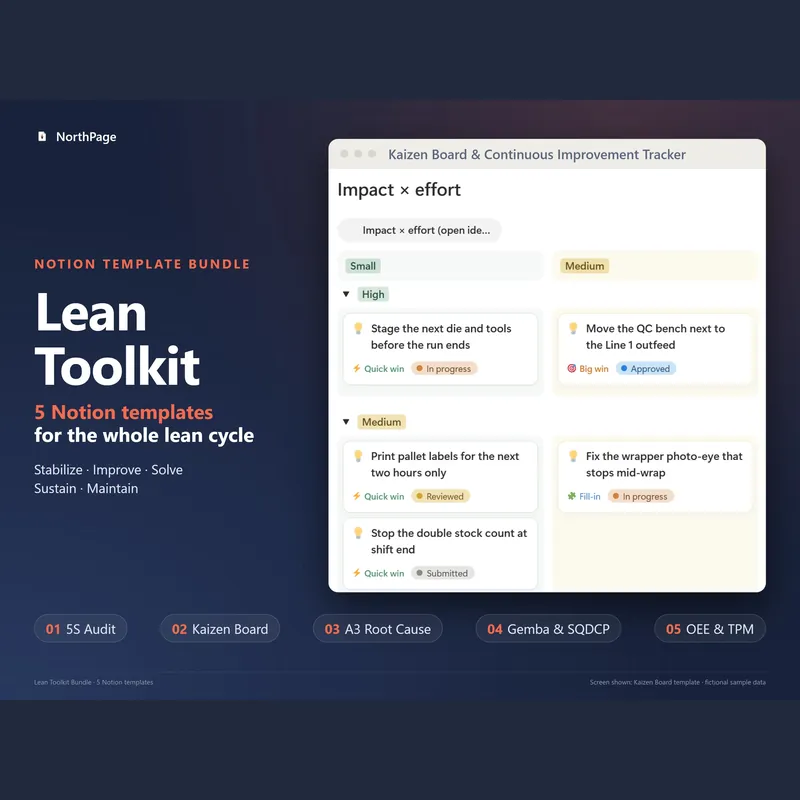
Yes. On its own it costs $29. The Lean Toolkit Bundle has all five templates (this one plus 5S, Kaizen, A3 and Gemba) for $79; bought one by one the five come to $145, so the bundle saves $66.
Delivery, refunds and choosing Etsy or Gumroad: see the main FAQ
OEE & Preventive Maintenance (TPM) Tracker
$29Pay once, no subscription · checkout on Etsy or Gumroad
More from the Lean Toolkit
Lean Toolkit Bundle: 5 Notion templates
5S Audit & Action Tracker for Notion
Kaizen Board & Continuous Improvement Tracker
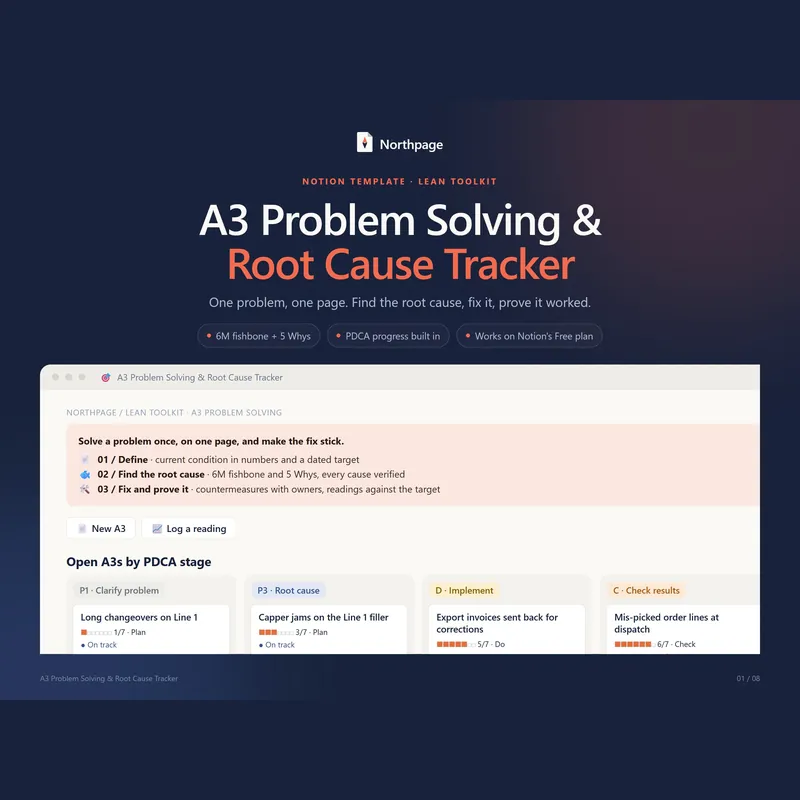
A3 Problem Solving & Root Cause Tracker
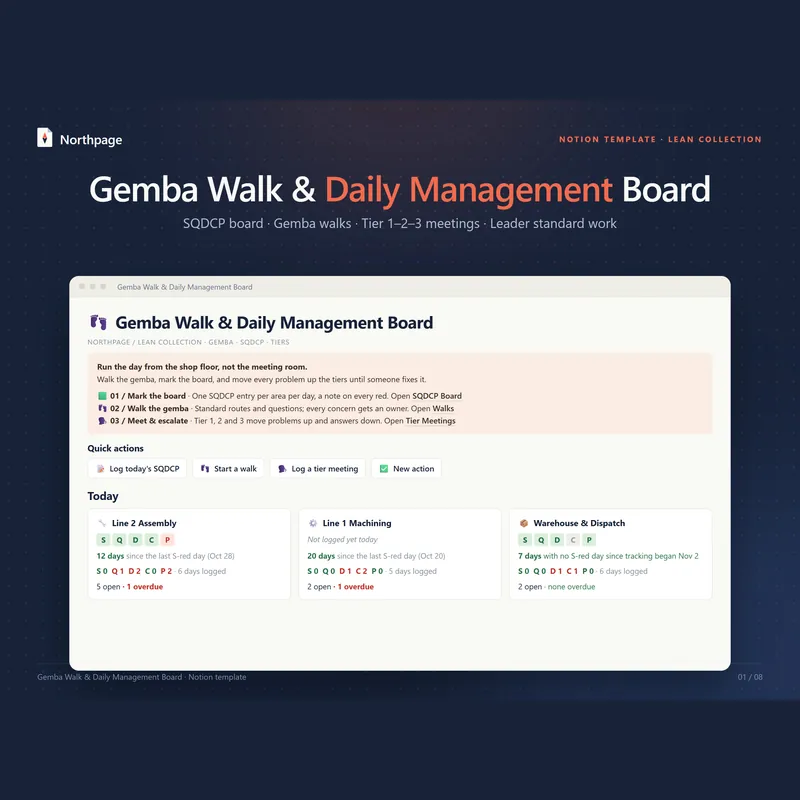
Gemba Walk & Daily Management Board (SQDCP)
All five templates come in the Lean Toolkit Bundle for $79 instead of $145 if bought one by one.